Community Cleanup Dashboard

Our New Community Cleanup Dashboard Is Live!
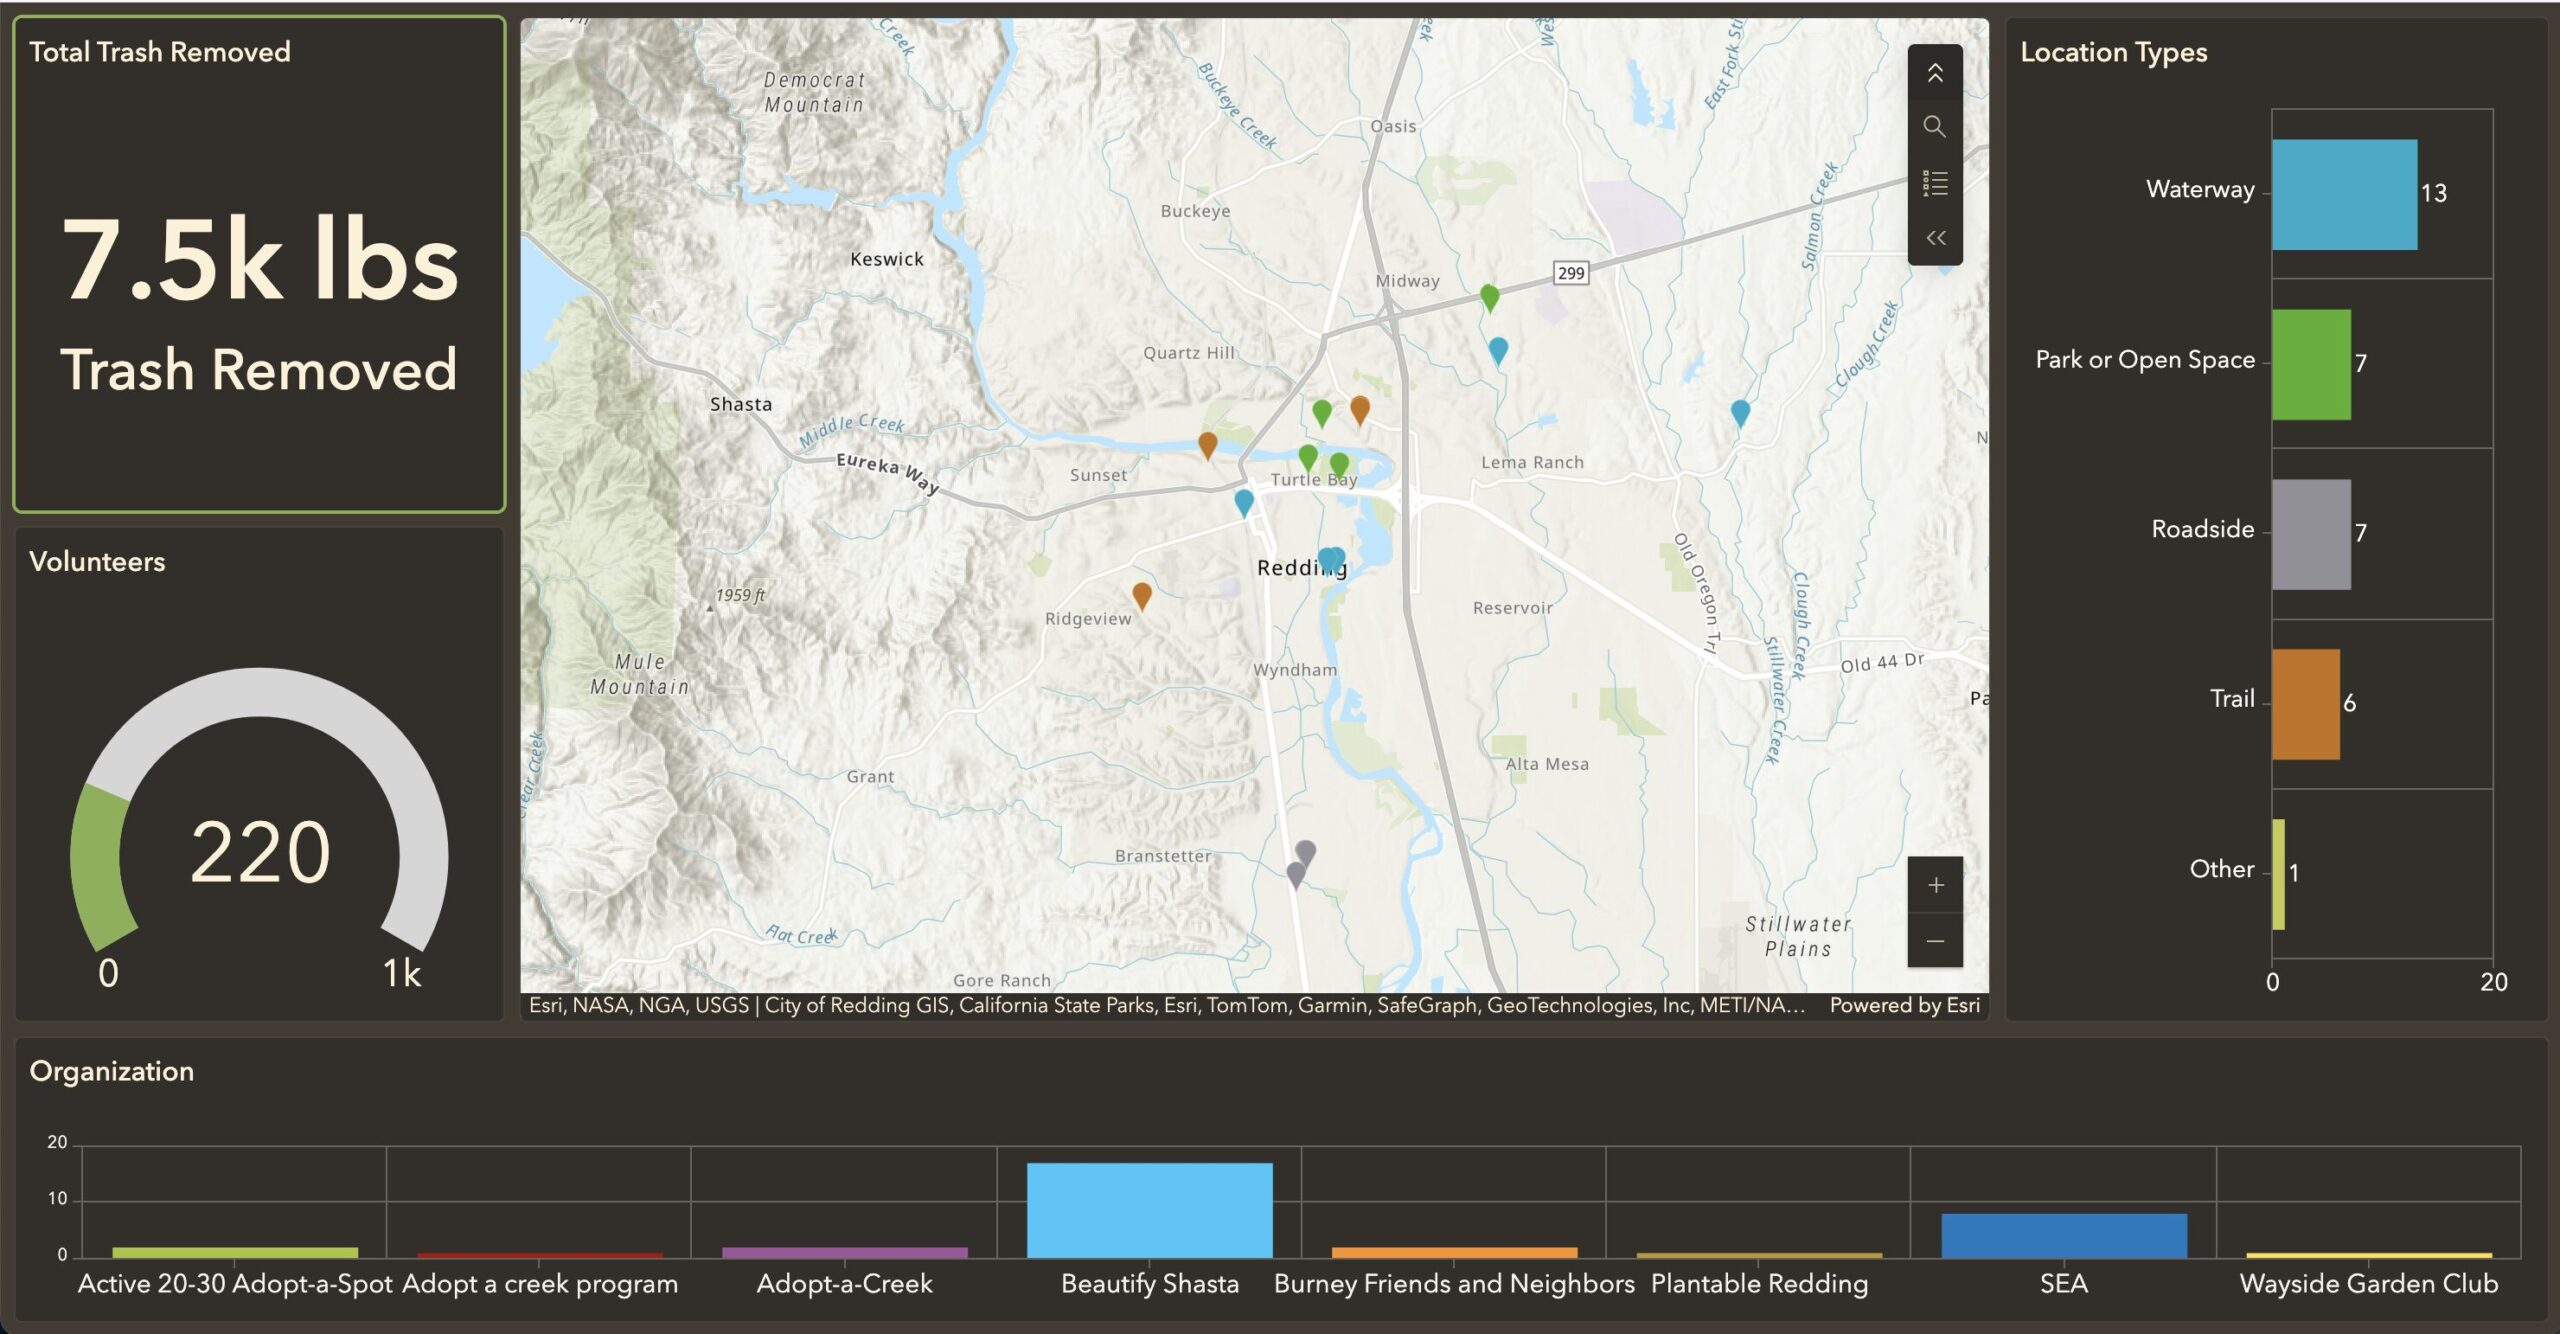
We just launched a shared, real time cleanup dashboard that brings community cleanup work together in one place. As reports come in, the map and charts update instantly so cleanup activity is visible as it happens.
Instead of cleanup efforts being scattered across posts, spreadsheets, and group updates, this dashboard shows the full picture. Cleanups are tracked by environment type like waterways, trails, parks, and open spaces so it is easy to see what areas have been cared for and what still needs attention.
Click an organization or environment type and watch the totals update right away, showing how much trash was removed and how many people helped. Groups can also upload before and after photos so the work behind the data is visible.
This tool gives cleanup work a shared, lasting place to live so it does not disappear after each event. Anyone can explore the dashboard and understand what has been done across the community.
If your group is doing cleanups, submit them through the form so your work shows up on the map and dashboard: Cleanup FormFeel free to backdate submissions if you have cleanups you would like to include on the dashboard.
If your organization tracks cleanups using GIS or mapped data, email [email protected] to explore integration options.
Thank you to Beautify Shasta for contributing their Q4 2025 cleanup data to help launch the dashboard. This is just the beginning, and it will grow as more community cleanup work is added.
Explore the dashboard here: Cleanup Dashboard